Integrating data sources into a full-stack data platform
How Y42 can take ELT to the next level. By Deborah Menezes
In a data-driven world, many companies deal with a huge amount of data regularly, but the more data is generated, the more important it becomes to collect, store, and analyze it. When new applications are on the rise, it becomes more difficult to maintain all of them. Then the question that arises is how to integrate all these applications into a single, unified, bird’s eye view. One possible solution is the data analytics platform Y42.
What is Y42?
A simple introduction to the platform can be found here. But in general, it is a full-stack scalable data platform that lets us extract data from different sources, build models, orchestrate, visualize and automate the data all in one place. This centralized data hub can then be easily maintained.

Let us deep-dive into how data from different sources can be integrated using the Y42 platform. Y42 can be used by anyone, not just data engineers or data analysts, but also non-technical users. This platform offers at the moment over 100+ connectors from SaaS applications to databases, event tools, and file systems.
To name a few available integrations: Shopify, Amazon Ads, Google Adwords, Google Analytics, Facebook, Tiktok Ads, Pinterest Ads, Instagram, WordPress, Bing, Google Sheets, JSON files, CSV files, BigQuery, MySQL, Oracle, and so much more.
Quick Integration Setup
- When you open Y42, the first page you will land on is the integration layer.
- Integrate your data sources/applications by clicking on Integrate from the navigation menu on the left and then click on ‘Add’.
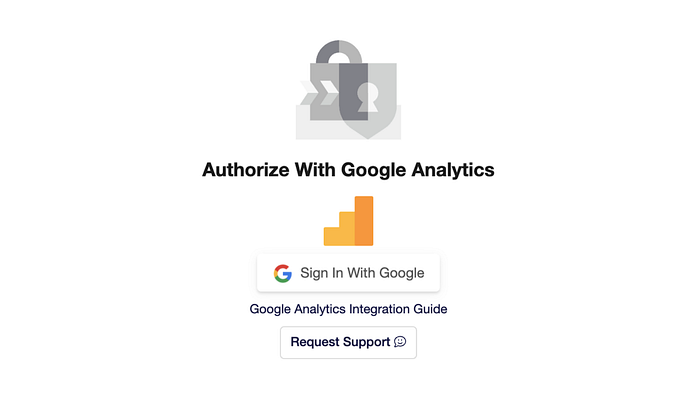
- Add the data sources you want to integrate. Each integration has its own way to connect. Let’s take Google Analytics (GA) for example. First, you name your integration.
- Then, you have to use your GA account credentials to authorize the connection.
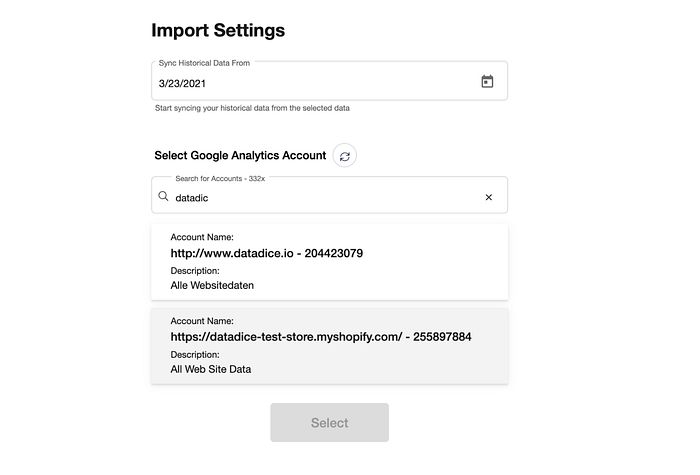
- Following this, you will get a list of all the available Google Analytics accounts you have access to with the chosen Google Account. Additionally, you can choose from which starting point you want to get the data
- Another integration example would be Google BigQuery. You would need a service key from your GCP project to connect it with Y42.
- All the steps for each data source integration are explicitly outlined in the tool, which makes the whole process very smooth for any user.
Manage your Integration
Once the integration is set up, the data is imported in a matter of minutes. You can even check the status of your import along with other details such as the number of tables that have been imported and the time it was created. The full schema is provided for each one of your integrations.
Overview Tab
This provides the basics of your integration: the number of tables and rows, the size of your table, or the status of your import. If any table import fails, it will be highlighted in a light red color. You can then manually trigger the import by clicking on re-import. Even logs of the import can be viewed.
Structure Tab
Once the table has been imported you can easily view each table and select the columns you need.
Data Tab
On the left-hand side, if you click on the tables that you have imported, you can already see all the data. The type of data each column has, whether they are text, number, or date formats, is also shown.
It is also possible to show the data in an ascending or descending order, just by clicking the column names. The preview is so interactive that it can show you the number of distinct data you have. You just need to hover the mouse over the vertical bars. Not only that, changing the order of the columns is as easy as drag and drop. You can also find the total number of rows and columns your table contains at the bottom of the screen.
Another one of Y42’s nice features is the fact that you can get an overview of some general statistics for each column. For example, if you hover the mouse on the “costs” column, (as shown in the figure below) a small bar-line graph symbol will pop up. And when you click on the icon, it shows you the basic calculations like the average, mean, median, and many more.
You can already see how powerful Y42 is. Not a single line of code is needed to integrate your data. And you even get to see the basic structure and statistics of the data.
Access Tab
Access control is a place where you can assign view or edit permissions to your team members.
Settings Tab
You can set up email notifications if a job fails during import. You can even revoke the integration if needed or delete the data source permanently.
Conclusion
Despite still being an emerging tool, Y42 offers incredible built-in features while still being an easy-to-use tool. Integrating various data sources is made so easy that it becomes impossible not to make use of them.
But there is still room for improvements, such as adding a raw API as a data source. However, the Y42 team is constantly refining the platform and adding new features, making it easy for everyone to use their data productively.
Once the integration part is completed and the data is imported into the platform, what needs to be done with the imported data? can it be updated on an hourly/daily/weekly basis? How can we merge different data sources? Can we even transform the data before we visualize it? In the next blog posts, we will dive deeper into the data modeling layer, which happens to be my favorite feature in Y42.
Upcoming datadice blog posts for this month
- Latest Updates on Google Data Analytics (April 2022)
- Effortless Ways to handle Google Analytics 4 data in BigQuery like a pro
Further Links
This post is part of the Y42 series from datadice and the series gives you detailed information on different features in Y42.
If you think that Y42 could be an attractive solution to your data problems, be sure to get in touch with them.
Check out our LinkedIn account, to get insights into our daily working life and get important updates about BigQuery, Looker Studio (formerly called Google Data Studio), and marketing analytics
We also started with our own YouTube channel. We talk about important DWH, BigQuery, Looker Studio (formerly called Google Data Studio), and many more topics. Check out the channel here.
If you want to learn more about how to use Google Looker Studio and take it to the next level in combination with BigQuery, check our Udemy course here.
Have trouble setting up an ETL Pipeline on Y42 or if you are looking for help to set up a modern and cost-efficient data warehouse or analytical dashboards in general, send us an email at hello@datadice.io and we will schedule a call.
Originally published at https://www.datadice.io.

